
Say you have followed the arc of this series. You ran the ROI arithmetic, deployed an agent on one or two workflows, chose the right channels, and set up escalation paths that aren’t dead ends. The agent has been live for six weeks. The vendor dashboard shows a healthy green number. And now your CFO asks the question that matters: how do we know it’s working?
This piece is the answer to that question — a measurement stack an operations team can use, in the order that the numbers stop being flattering and start being true.
Why deflection rate fails you
We have criticised deflection before, but it is worth stating precisely, because the metric fails in a specific way. Deflection measures the absence of a human touch, not the presence of a resolution. A bot that replies “your order is on the way” to a customer whose parcel has sat at a Bhiwandi hub for four days has deflected the ticket. The customer returns 48 hours later, angrier, on a more expensive channel — and the dashboard counts the first touch as a win.
The deeper problem is that deflection is a vendor-side metric. It can be improved by making the bot more stubborn, the escalation path more hidden, the replies more verbose — all of which raise the number while damaging the operation. Any metric that can be improved by harming the customer will eventually be improved by harming the customer.
Layer one: resolution, measured by behaviour
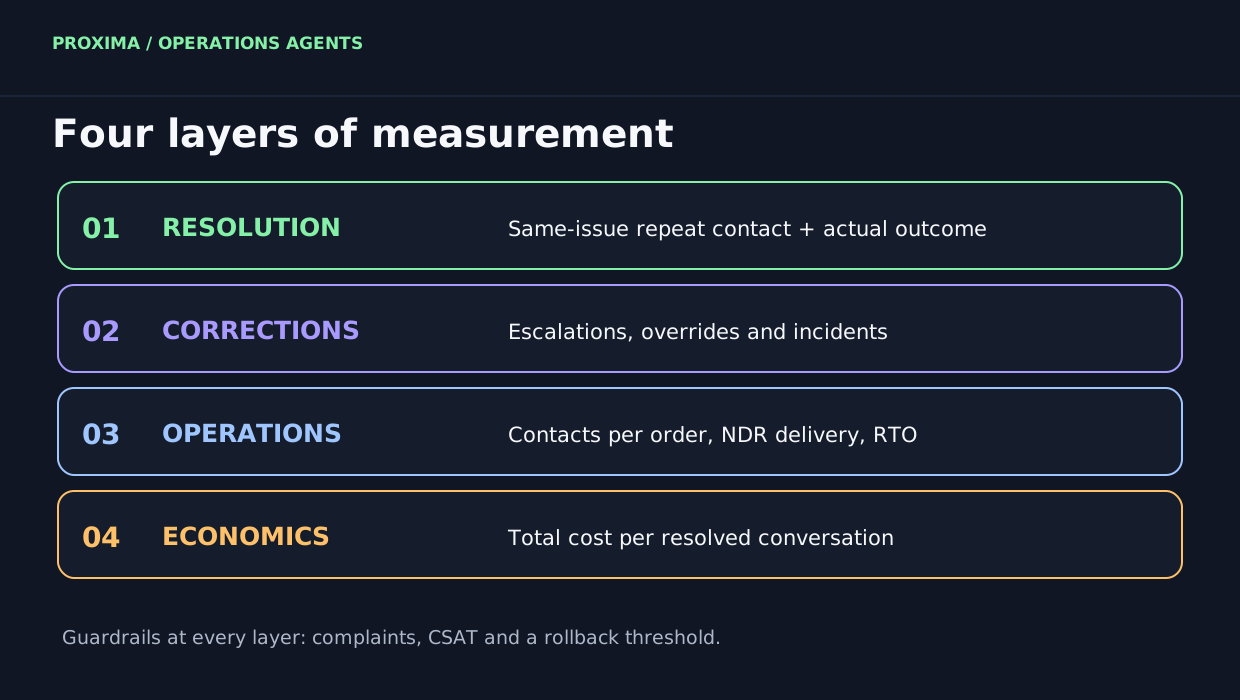
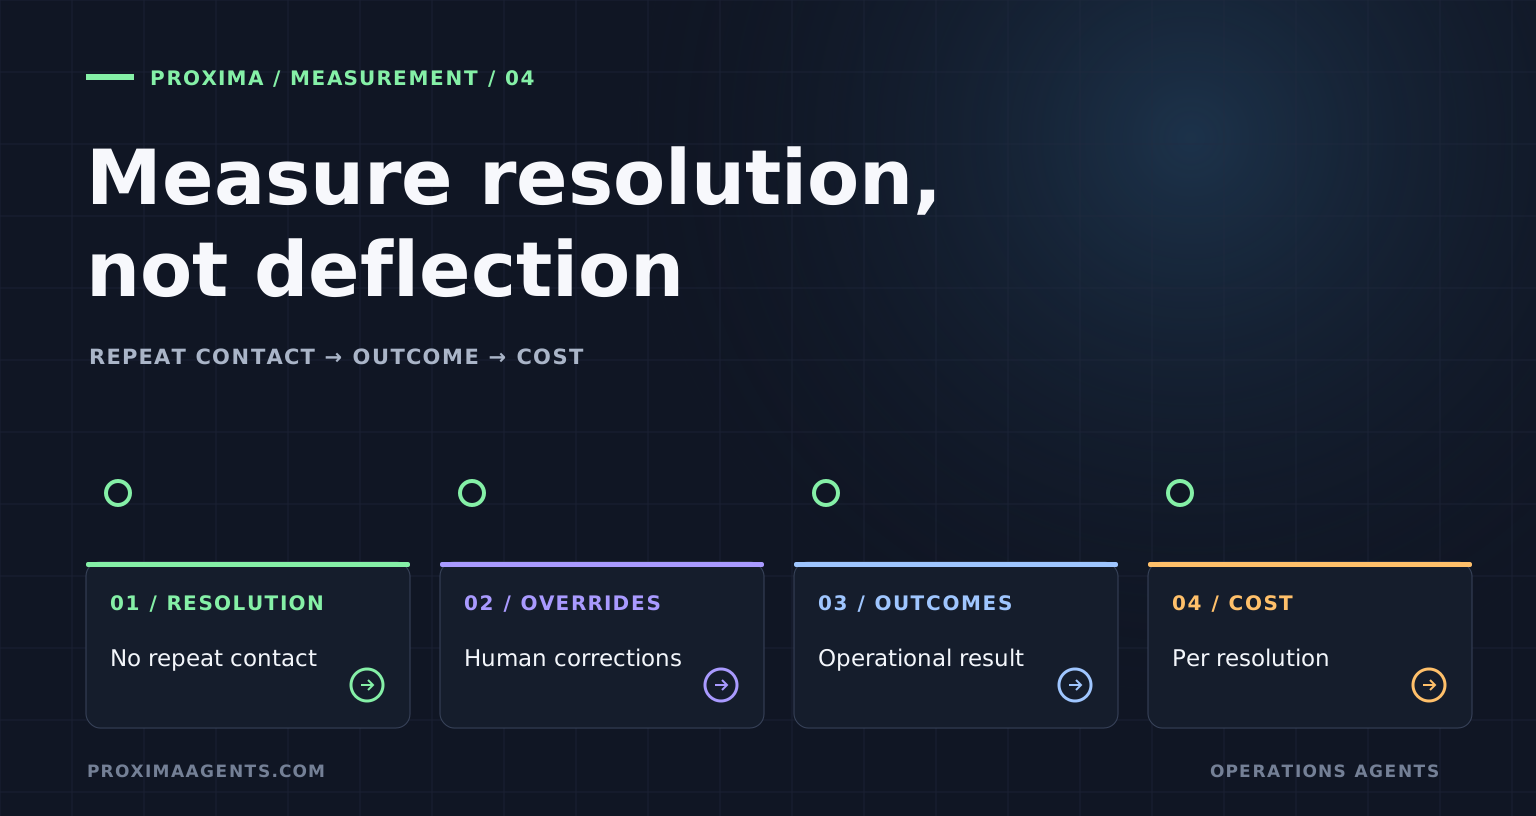
The better starting measure is resolution rate, checked against customer behaviour and the operational outcome. A no-repeat-contact window — for example, 72 hours for support and longer for refunds — is one useful proxy. Pair it with the actual order or refund state, because silence alone does not prove the problem ended. Surveys and thumbs-up scores can add context, but they cannot replace that check.
This single redefinition changes everything downstream. The repeat-contact rate becomes a first-class metric rather than a footnote. For example, if 60% of WISMO tickets are marked closed by the agent but a third of those customers return about the same issue, only 40% of the original tickets meet that no-repeat definition. Repeat contacts also add handling cost. A closure dashboard and a resolution dashboard can show very different results for the same queue.
Two companion metrics live here. Time to resolution, because a correct answer in four seconds and a correct answer in four hours are not the same product. And answer completeness — for WISMO, the test is whether the reply contained a date. An answer without a date is a repeat ticket waiting to happen, and you can audit for it mechanically.
Layer two: the escalation and override gauges
An operations agent is not only producing answers; it is producing decisions and referrals. Those need their own gauges, and they are the ones your ops lead should watch daily.
Escalation rate by category. As we argued in the escalation piece, this is a vital sign, not an embarrassment. A falling rate may mean the team has improved the workflow, but check the outcomes before celebrating. A persistently high rate may point to an overly broad category or poor input data. A sudden spike warrants checking upstream changes such as a courier status code, sale volume or a broken template.
Override and correction rate. During approval-gated phases, how often does the human modify or reject the agent’s recommendation? That rate is the agent’s accuracy, measured against your own team’s judgment — the same scorecard logic as Shadow mode, kept running in production. Rollback and incident count belongs here too: how often did an automated action have to be undone, and what did each undo cost. An agent with zero rollbacks and a rising override rate is being held by your team. An agent with rollbacks and no overrides is outrunning its supervision. You want the first, briefly, on the way to neither.
Layer three: operational outcomes, where the money is
Layers one and two measure the agent. Layer three measures the operation — and it is the only layer your CFO actually cares about.
For a WISMO workflow, track WISMO contacts per 1,000 orders weekly against your pre-deployment baseline, with the share of inbound contacts as context. A falling share alone can reflect changes in other categories. For NDR recovery, track delivery after NDR and COD RTO rate, then calculate rupee impact from your own freight, handling and margin data. For refunds, track median time from QC pass to credit and “where is my refund” contacts per 1,000 returns.
The discipline that makes layer three credible: fix the baseline before deployment, from your own data, and agree it in writing. A vendor who measures improvement against a baseline they invented after go-live is grading their own homework. A diagnostic should compute the current numbers — the review exists so that “is it working?” has an answer that predates the agent.
Layer four: the one number for the board
At the bottom of the stack sits the metric that survives a finance review: cost per resolved conversation — total support cost for the covered categories, agent subscription included, divided by conversations closed with no repeat contact inside the window. Run it against your measured pre-agent baseline, and the ROI conversation stops depending on anyone’s dashboard.
Add two guardrail metrics so the efficiency number cannot be gamed: CSAT delta on agent-handled conversations versus human-handled ones (a small, consistent gap is acceptable; a widening one is a leading indicator), and complaint volume, because the fastest way to cut cost per conversation is to make customers give up, and complaints are where that failure surfaces first. Cost per resolution, held honest by CSAT and complaints, is the complete story in three numbers.
A measurement cadence you can actually run
Weekly: resolution rate, repeat contact, escalation rate by category, overrides — the operational gauges, reviewed by the ops lead in twenty minutes. Monthly: the outcome layer — WISMO share, NDR recovery, RTO points, refund TAT — against the fixed baseline. Quarterly: cost per resolved conversation and the CSAT delta, in the format finance expects. And continuous: an agreed error threshold per action category, below which the category automatically reverts to human approval. Measurement that cannot revert authority is monitoring. Measurement that can is governance.
What this does not fix
Honest measurement cannot make a bad agent good — it can only make the badness visible early and cheaply, which is the entire point of the phased model. It also cannot survive missing instrumentation: if your repeat contacts are not linked across channels — the WhatsApp thread and the email about the same order — the resolution number will flatter itself no matter how honestly it is defined. Identity stitching across channels is boring plumbing, and it is the precondition for every metric in this piece.
Finally, no measurement stack answers the question of what to automate next. The metrics tell you whether the current workflow is working. Finding the next queue worth automating is a diagnostic exercise again — which is why the measurement layer and the process review are the same motion, repeated.