
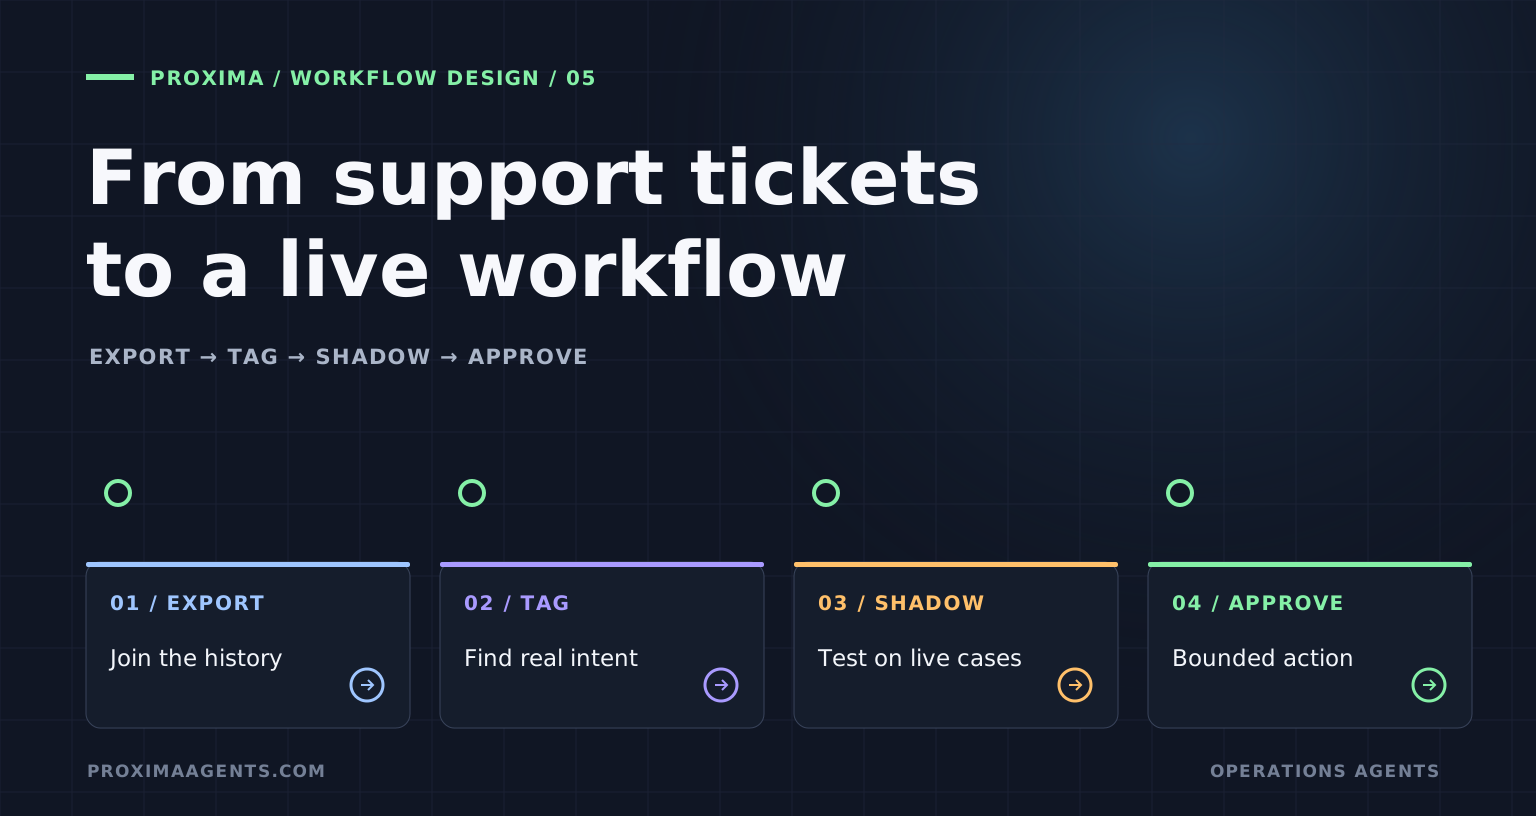
Throughout this series we have promised the concrete version of “historical cases become a running operational workflow.” This is that piece. It follows one illustrative brand — call it a mid-size D2C label shipping 4,000 parcels a day across Delhivery, Xpressbees and Ekart, 55% COD — through every step, with illustrative numbers at each stage. The brand and figures below are a constructed example, not a customer deployment or measured result. The same method can be applied in a process review. Bring your own 90 days and the same arithmetic applies.
Step 1: Export everything, including the ugly parts (days 1-2)
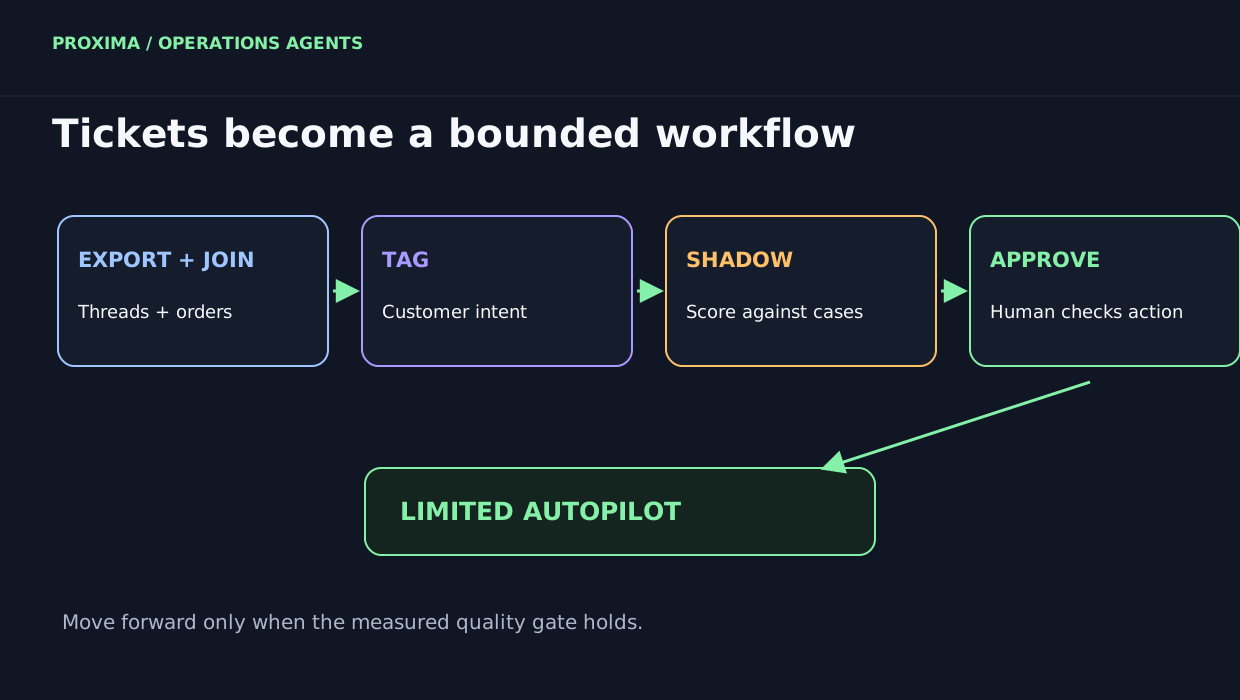
The starting material is 90 days of support conversations — in this brand’s case, 27,300 tickets from the helpdesk, plus the WhatsApp business inbox that held another 8,900 conversations nobody had ever counted. That second source matters: at some brands, substantial customer contact lives outside the official ticketing system, and an analysis of the helpdesk alone systematically understates the queue.
Pull, per conversation: timestamps, channel, full thread, agent handle, first-response and resolution times, and whatever tag the agent applied — while checking how many tags are wrong or missing. Also pull the operational data the tickets reference: order IDs, courier, scan events. The tickets are the symptom record. The scan data is what turns symptoms into categories.
Step 2: Tag by what the customer wanted, not what the agent clicked (days 3-6)
Re-tag a sample of 3,000 conversations, stratified across channels and categories, by customer intent. This brand’s queue, once honestly tagged:
| Category | Share | Minutes per ticket | Automatable? |
|---|---|---|---|
| WISMO (“where is my order”) | 44% | 8 | Yes — retrieval from scan data |
| Refund / return status | 19% | 11 | Partly — rules inside policy limits |
| Address or order change | 9% | 12 | Yes, before dispatch only |
| COD / payment queries | 8% | 6 | Mostly, on WhatsApp |
| NDR follow-ups | 7% | 14 | Yes — the recovery workflow |
| Complaints (late, damaged, rude) | 13% | 22 | No — stays with people |
In this constructed example, 61% of WISMO tickets arrived after the promised date had passed. The exercise would point to a delay-communication problem, rather than only a question-answering problem. NDR follow-ups had also been tagged as generic WISMO, so the team would separate that time-critical queue. The ledger would make WISMO the volume candidate and NDR the value candidate.
Step 3: Attach the money (days 6-8)
Each category gets two costs. The visible one: share × volume × minutes × loaded agent cost per minute. With 36,200 conversations in 90 days, a 44% WISMO share, eight minutes per ticket and ₹1.20 per loaded minute, WISMO handling comes to about ₹153,000 over the period, or ₹51,000 per month. The less visible cost requires a separate join to order data: if COD refusal is higher among customers with an unresolved WISMO ticket, investigate whether poor communication contributes to the RTO line. Correlation alone would not establish the cause.
This is the step that separates a workflow project from a chatbot purchase. The output is a per-category business case, in rupees, computed from the brand’s own data — the same ledger format from our support cost breakdown.
Step 4: Define the category precisely (day 8)
“Automate WISMO” is not a specification. The working definition that came out of the ledger: a WISMO conversation qualifies for automation when the order ID is identified, the parcel has a scan event within the last 48 hours, and the customer is not expressing a complaint. Everything else — no scan for 48+ hours, third NDR attempt, anger, data contradicting the customer’s account — routes to people through the escalation design, with the full case file attached.
The definition also fixed the answer standard, drawn from the historical tickets that actually closed without repeat contact: every automated answer must state the last scan in plain language, a realistic date, and what happens next if the date is missed. That standard was learned from the brand’s own best agents’ threads — the historical data teaching the workflow what “good” already looks like.
Step 5: Shadow against history, then against live traffic (weeks 2-4)
Before touching a live customer in this example, the team replays 1,800 historical WISMO threads. A reviewer scores each draft for factual support, policy fit and whether it would have addressed the customer’s question; matching the historical agent’s wording is not the goal. The review reveals two failure modes: parcels stalled at a hub with no useful recent event, and multi-parcel orders where the customer asks about “my order” but means the delayed parcel.
Both fixes come from the ledger: when a scan is stale, the answer states what is known and avoids inventing a delivery date; a multi-parcel query prompts a disambiguation question. The team sets a quality gate in advance, including no fabricated dates, and then moves to live Shadow only if a second reviewed sample clears it. In Shadow, the agent drafts answers for incoming tickets while agents continue sending their own.
Step 6: Approval, then limited autopilot (weeks 4-10)
After live Shadow meets the agreed quality gate, the category can graduate to human approval. Agents review drafted answers with the supporting scan attached. Measure review time and corrections against the original eight-minute handling baseline; approval mode is useful only if the answer is sound and the review actually saves time.
Once approval data shows a stable low correction rate and acceptable customer outcomes, one narrow sub-category could move to limited autopilot: on-track queries backed by a recent scan, answered on an opted-in WhatsApp channel with an approved template, capped per day and monitored per the measurement stack. Delayed-parcel answers stay in approval. Complaints stay with people.
Step 7: Review the scoreboard at day 90
At day 90, compare agent-handled WISMO with the historical and concurrent human baselines: same-issue repeat contact within 72 hours, contacts per 1,000 orders, time to resolution, corrections, complaints and cost per resolved conversation. For cost, include software, review and exception handling alongside agent time. Keep COD refusal and RTO as separate order-level measures, segmented by courier and customer mix, so a shift in order volume is not mistaken for a workflow effect. This constructed case does not provide measured post-launch results.
If those measures improve without hiding complaints or increasing repeat contact, the team can shift capacity toward complaint and NDR exception queues, then run the ledger again to check the next opportunity.
What this does not fix
The walkthrough hides three preconditions. Identity stitching: the WhatsApp thread and the email about the same order must resolve to one customer, or both the tagging and the resolution metrics lie. Scan data access: the whole WISMO case rests on reading courier events reliably across partners, and brands without API or feed access build that plumbing first. And a clean category: if the tagging step had found WISMO inseparable from complaints in the threads, the honest output would have been a smaller scope — which is why the tagging happens before anyone promises anything.
It also does not end. Categories drift — a courier changes status codes, a sale doubles volume, a policy edit breaks a template — and the scoreboard’s job at day 90 is to keep the day-900 answer as honest as the day-90 one. A running workflow is not a finished project. It is a ledger that stays open.